
Ever checked your bank balance and felt that gut punch from an unexpected overdraft? You are not alone. Many skip tracking because money apps feel too pushy or complicated. They nag with subscriptions or ads.
Spreadsheets change that. They cost nothing. You customize them fast. They work offline. Plus, they paint a clear picture of your cash flow. In April 2026, free Google Sheets templates make setup a breeze.
This guide walks you through it all. You will pick a tool, grab a template, set it up, build habits, and spot savings. Anyone can start today. You could save hundreds in months. Let’s get your money under control.
Pick the Best Spreadsheet Tool for Easy Money Tracking
Start with the right tool. Google Sheets tops the list for most folks. It runs free online. Changes save automatically. You share links easily with family. Built-in templates speed things up.
Excel works too. It shines offline. You handle more formulas there. A free web version exists. But Google Sheets fits beginners best in 2026. Mobile apps let you enter spends on the go.

Google Sheets edges out because real-time updates beat Excel’s delays. You collaborate live. It stays free forever. Phones sync seamless. For example, open sheets.google.com. Click Template Gallery. Search “budget” for starters.
Google Sheets Wins for Most People
Most pick Google Sheets. It handles daily tracking fine. No slowdowns for personal use. Share with a spouse. They edit while you add groceries.
Access templates quick. Go to sheets.google.com. Hit Template Gallery. Choose Monthly Budget. It auto-fills categories and charts. Check free Google Sheets budget templates for more options.
When Excel Makes More Sense
Excel suits if you own it already. Offline access helps travel. Complex formulas come later. Download free from Microsoft. Pair with Vertex42 budget templates.
It overkills basics, though. Stick to Sheets unless data piles high.
Grab a Free Template and Make It Yours in Minutes
Templates save hours. Top 2026 picks include Google Sheets Monthly Budget. It contrasts income versus actual spends. Charts update live.
Smartsheet Household tracks family costs. Pie charts show splits. Vertex42 offers yearly views. Tiller Foundation auto-feeds data if you want. The 50/30/20 follows a simple rule: 50% needs, 30% wants, 20% savings.
Search in your tool. Or visit sites. Duplicate sheets for new months. Start simple. Overwhelm kills habits.
Best Beginner Pick: The Monthly Budget Template
Google’s Monthly Budget shines for newbies. Columns cover planned, actual, and difference. Categories hit rent, food, fun. Auto-charts track trends.
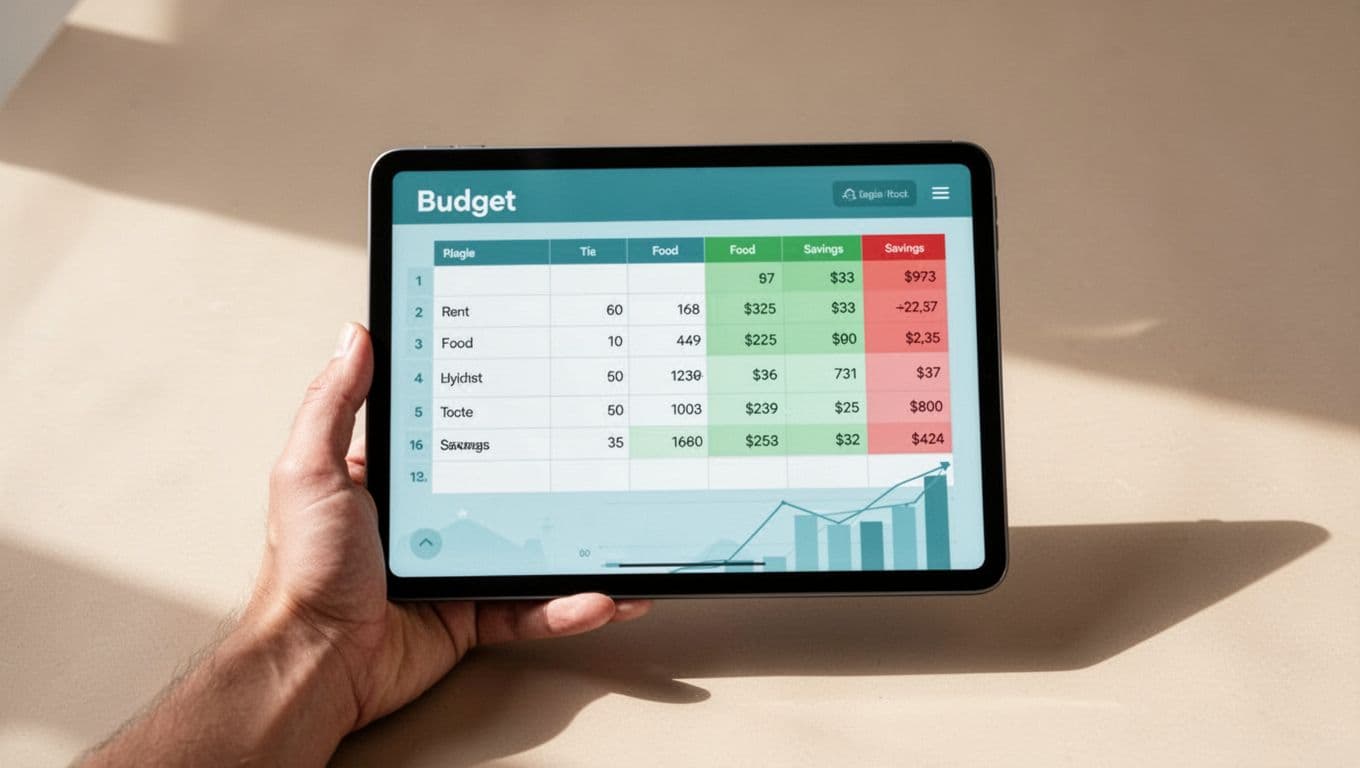
Here is a sample:
| Category | Planned | Actual | Difference |
|---|---|---|---|
| Rent | 1200 | 1200 | 0 |
| Groceries | 400 | 450 | -50 |
| Fun | 200 | 150 | 50 |
| Total | 1800 | 1800 | 0 |
Formulas like =SUM(B2:B10) total rows. Color over-budget red. Under green.
Try the 50/30/20 Rule for Fast Results
This rule simplifies. Assign 50% to needs like rent or food. 30% to wants such as dining out. 20% saves or pays debt.
Templates compare planned to real. Cut extras fast. Grab a free 50/30/20 Google Sheets template.
Advanced Option: Track Net Worth Too
Add assets minus debts on one sheet. Vertex42 or Tiller templates fit. Keep daily logs simple. Yearly views motivate.
Set Up Your Tracker: Enter Income and Log Every Spend
List income first. Salary, gigs go top row. Add 10-15 expense categories. Columns: date, description, amount, category.
Set planned budgets. Formulas compute balance: total income minus expenses. Difference: planned minus actual.
Color code. Green means under. Red signals over. Update weekly at first. Shift to daily.
Quick Categories That Cover Everything
Keep lists tight:
- Income
- Rent/Mortgage
- Utilities
- Groceries
- Dining Out
- Gas/Transport
- Health
- Entertainment
- Clothing
- Savings
- Debt Payoff
Group needs versus wants. Patterns emerge quick.
Formulas That Do the Math for You
No coding needed. Use =SUM(B2:B20) for totals. =C2-B2 shows differences. Charts pull from ranges.
Data auto-updates visuals. Enter spends. Watch insights grow.
Build Habits and Use Charts to Save More Each Month
Log same day via phone. Review Sundays. Check overspends. Adjust next week.

Aim zero-based. Assign every dollar. Copy sheets yearly. Track net worth rise. Set reminders. Share with partners. Celebrate small wins like $100 saved. Skip perfection. 80% beats zero.
Weekly Check-Ins That Keep You on Track
Compare actual to planned. Food hit $450 versus $400? Skip eating out. Roll extras to savings. Simple tweaks add up.
Charts Reveal Where Your Money Really Goes
Pie charts split expenses. Bars show month trends. Customize colors.

Spot leaks. Transport spikes? Bike more. Data turns blind spots to fixes.
Simple spreadsheets deliver clear wins. Setup takes minutes. Insights build savings without apps. Start with a Google template today.
Three months in, habits stick forever. Download one now. Share your results in comments. Your finances, simplified. You got this.